
“Anything that is measured and watched, improves.”
We agree. Using metrics should be an essential component of your business’ internal communications strategy to keep your team informed and aligned, and there are few better ways to do so than with Geckoboard.
Geckoboard allows you to quite literally watch a wide variety of your business’ key performance indicators (KPIs), all in one place by building KPI dashboards. KPI dashboards provide your team with easy-to-consume representations of their progress and goals in the form of text, numbers, charts and graphs, enabling them to make more informed decisions and react quickly to issues needing attention.
Who uses KPI dashboards, and where? Any organization large or small where numbers matter, in their conference rooms, in their sales, marketing, operations and customer support departments, or on personal monitors.
Enplug’s Geckoboard integration allows you to display your KPI dashboards on TV screens in your office, so your business can further benefit from them. Doing so helps foster a data-centric culture, instill a results-driven attitude and encourage more workplace communication. We’ve outlined what you can include in Geckoboard dashboards and why displaying them will be your new favorite productivity tool.
Introduction to Geckoboard
Geckoboard is a KPI dashboard software enabling you to build custom dashboards showcasing your business’ key metrics. These dashboards are made up of widgets, which consist of your business’ KPIs in the form of text, numbers, graphs or maps. KPI dashboards can cover a wide range of data, no matter the department.
KPI dashboard widgets can be custom, where you provide the data feed source, or integrations, which pull data from popular third-party services such as Salesforce, Zendesk or Google Analytics. Integrations refresh every few minutes, while custom widgets allow you to choose the refresh time. Geckoboard also has basic built-in widgets like Clock, Excel and Text.
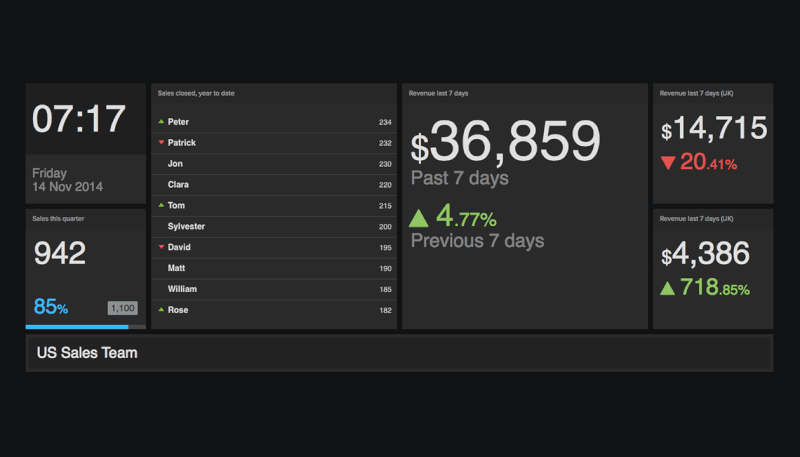
Sales KPI dashboard example (photo via Geckoboard)
You may build a KPI dashboard from scratch, or use a template to help you get started. Both options are highly customizable to suit your business’ needs. We’ll begin with building your dashboard from scratch using integrations.
Available Integrations
With Geckoboard, creating a KPI dashboard from scratch is not nearly as difficult as it may sound. Whether you’re looking to build an operations dashboard, a marketing and sales dashboard, or even an engineering dashboard, it’s a matter of choosing widgets – the building blocks of your dashboard – then configuring and arranging them. Geckoboard’s integrations allow you to use data from third-party software to fill your widgets.
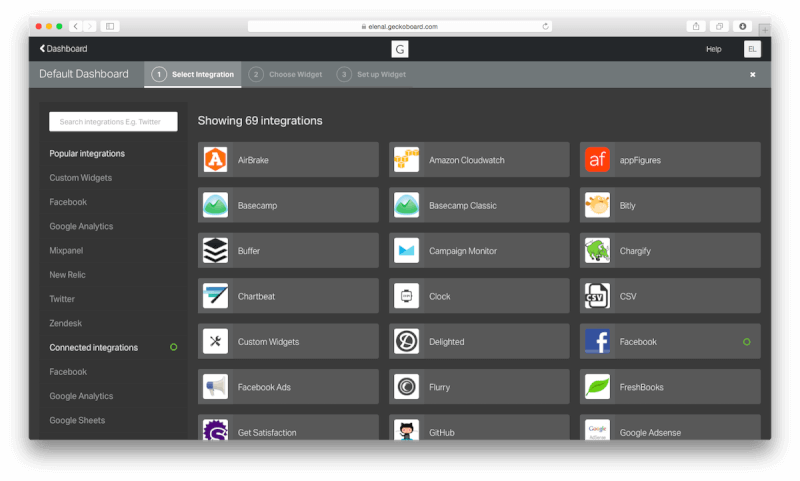
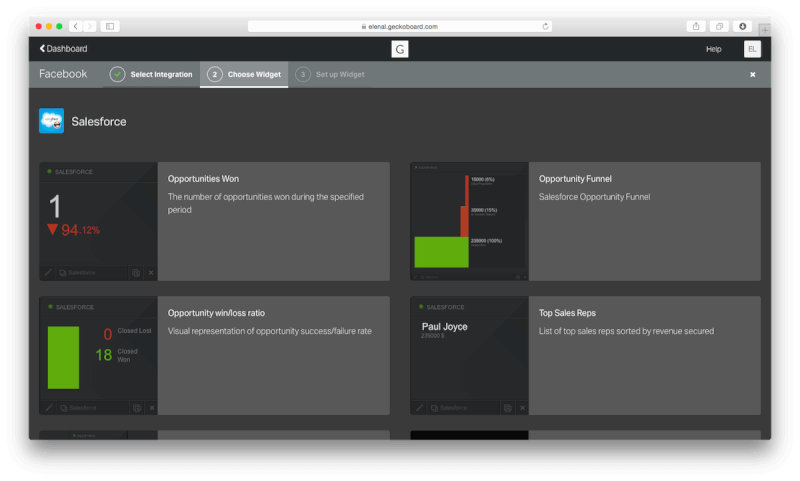
Click ‘Add Widget’ and you’ll see a list of integrations available. Included are major social media platforms like Facebook, Twitter and Instagram, as well as popular sales and marketing services.
Each integration can cover a wide variety of metrics. Popular integrations include:
Track your company’s Facebook page stats such as likes, page visits, total impressions and user demographics, or see the performance of individual posts. A separate Facebook Ads widget is also available.
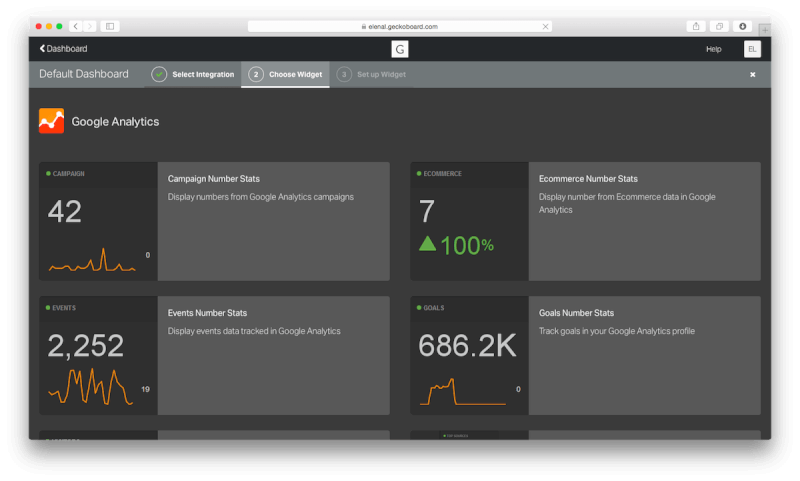
Google Analytics
Google Analytics is the go-to web analytics tool for over 10 million websites. It has more than enough metrics available to create an entire web analytics dashboard around. Show current visitor counts, visitor number stats, traffic sources, top pages, ecommerce stats or even current visitor location maps.
Google Sheets
Geckoboard’s Google Sheets integration offers a straightforward, quick way to input custom spreadsheet data without having to use a custom widget. Display data in the form of bar charts, line charts, funnel graphs, leaderboards, simple text or numbers, and more.
HubSpot
Use the HubSpot integration to create a marketing KPI dashboard, with metrics such as content conversion assists, landing page visits and submissions, and new contacts. You can display current totals and/or graph figures over time.
Salesforce
Create a Salesforce dashboard and your reps will thank you. Show important sales metrics like your opportunity win/loss ratio, new leads, converted leads, current open opportunities and deals in pipeline, or even showcase your top sales reps.
Zendesk
Integrate with Zendesk to help your customer support team and, ultimately, your customers. Include ticket counts, ticket stats like average resolution times, your satisfaction rating, who the top ticket solvers are, recent satisfaction rating comments from customers and more.
Other integrations available include:
• Basecamp
• Bitly
• Buffer
• GitHub
• Google Calendar
• Mailchimp
• PayPal
• Shopify
• Trello
One particularly valuable feature is adding a goal to a widget, so your team can visualize the goal and their proximity to it. Perhaps make it a monthly sales figure or a number of organic search sessions to reach. Any data above the goal you set will be highlighted.
Edit a widget’s settings at any time by hovering over it and clicking in the lower right corner. You may want to change a widget’s size so it takes up more or less space in your dashboard, make the title more specific, or change the time period to see more trends. You can also rearrange the widgets within your dashboard by dragging and dropping them.
Tip: Does your business have its own application or database, or you don’t see one of your services in the list of integrations available? You can still add your data to a Geckoboard dashboard by using custom widgets. You’ll need to provide the URL (and optionally the API key) of the data feed. Custom widgets also allow you to choose how frequently the data gets refreshed.
Using a KPI Dashboard Template
To make things even easier, Geckoboard also enables you to build your dashboard using a KPI dashboard template. After clicking ‘Add dashboard’, you’ll see the following:
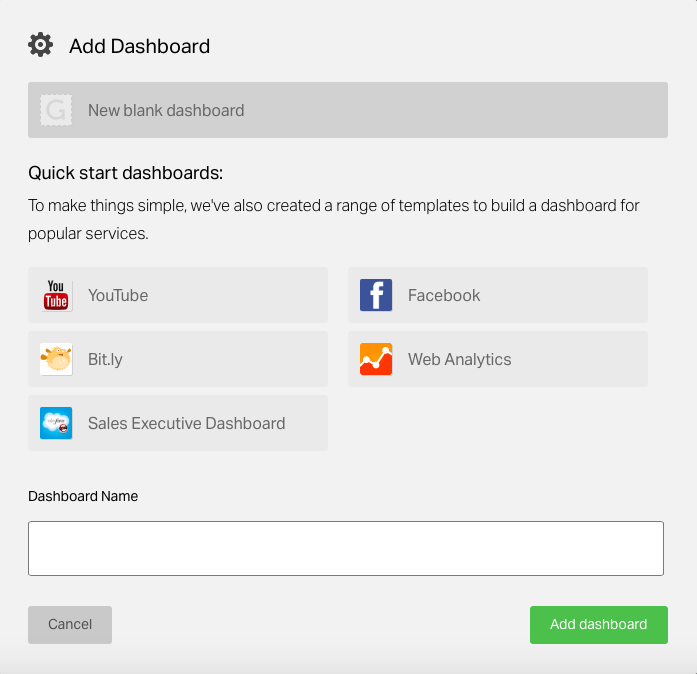
These templates involve certain integrations, so to create a Sales Executive Dashboard you’ll need a Salesforce account, for a Web Analytics dashboard you’ll need a Google Analytics account, etc.
Use one of these templates if you need a quick and easy way to generate a dashboard, if you’re looking to create a dashboard around one integration only, or if you’re new to Geckoboard and not sure where to begin.
Tip: Want more customization options? Open a dashboard and go to ‘Settings’ > ‘Dashboard settings’. There you can change the name of your dashboard, the location and timezone, the color scheme and more, or even add your own CSS.
Displaying KPI Dashboards on Enplug Screens in Your Office
Your KPI dashboards will only be useful and effective if your team can see them, and the more they see them, the better. Displaying your dashboards on Enplug-powered screens in your workplace is a convenient way to ensure your team has instant and continuous access to the KPIs they need to see.
Rather than having to dedicate a browser tab or even a whole monitor, several of your team members will be able to look at the same dashboard on a single screen, saving everyone time and space. Meetings will also run much smoother and be more productive when you display KPI dashboards in the conference room.
Think about displaying certain dashboards in strategic locations within your office, e.g. display your sales KPI dashboard where your sales team sits, your marketing KPI dashboard where the marketing team works, or a comprehensive dashboard in a communal area. Get the right information to the right people, all the time.
What gets measured gets managed, and seeing is believing. Enplug’s Geckoboard app is the perfect marriage between metrics and visual communications to keep your team focused and goal-driven.
Important Notes about Using Geckoboard with Enplug
Geckoboard allows you to customize the number of columns your dashboard can have. This setting changes the width of your dashboard. For Enplug, you should use the following dimensions:
- Fullscreen: 8 columns wide, 4 widgets high
- Zoning enabled with Banner: 6 columns wide, 4 widgets high
If you don’t use those dimensions, you’ll either end up with blank space on your screen or with some of your dashboard content not displaying.
To enable Geckoboard on your Enplug display, visit the Enplug App Market.
Want to learn more about using Enplug in your office? Schedule a demo today.